RangeBreak
What You Need
TradingView
Pro, Pro+, or Premium plan
TCT Premium
Invite-only access with subscription
Sub-Hourly Charts
1m, 5m, 15m, 30m, or 45m
Alerts
Bullish & bearish breakout alerts
How It Works
Three configurable times define the indicator — set them in 1-hour increments to monitor any range you want. All times are in Eastern Time and auto-adjust for DST.
Range Start
default 6:00 AM ETThe indicator begins tracking the session high and low. Every bar's high and low is captured to build the range.
Range End
default 10:00 AM ETThe range locks in and breakout monitoring begins. From this point forward, the indicator watches for price to break above the range high or below the range low.
Box End
default 4:00 PM ETThe visual box stops drawing. By now the session outcome is clear — the box color tells you exactly what happened.
All three times are configurable in 1-hour increments. Defaults are optimized for US index futures (ES, NQ, YM, RTY) — adjust for Forex, stocks, or crypto sessions.
Color-Coded Breakout Boxes
The box color changes based on the session outcome — see what happened at a glance without reading a single number.
Bullish
Price broke above range high
Bearish
Price broke below range low
Both Broken
Both levels broken — choppy session
No Breakout
Range held — low volatility day
Fibonacci Extension Targets
After a breakout, profit target lines are automatically projected from the broken level. Lines only appear in the breakout direction.
Optional price labels show exact target prices. Toggle individual levels on or off.
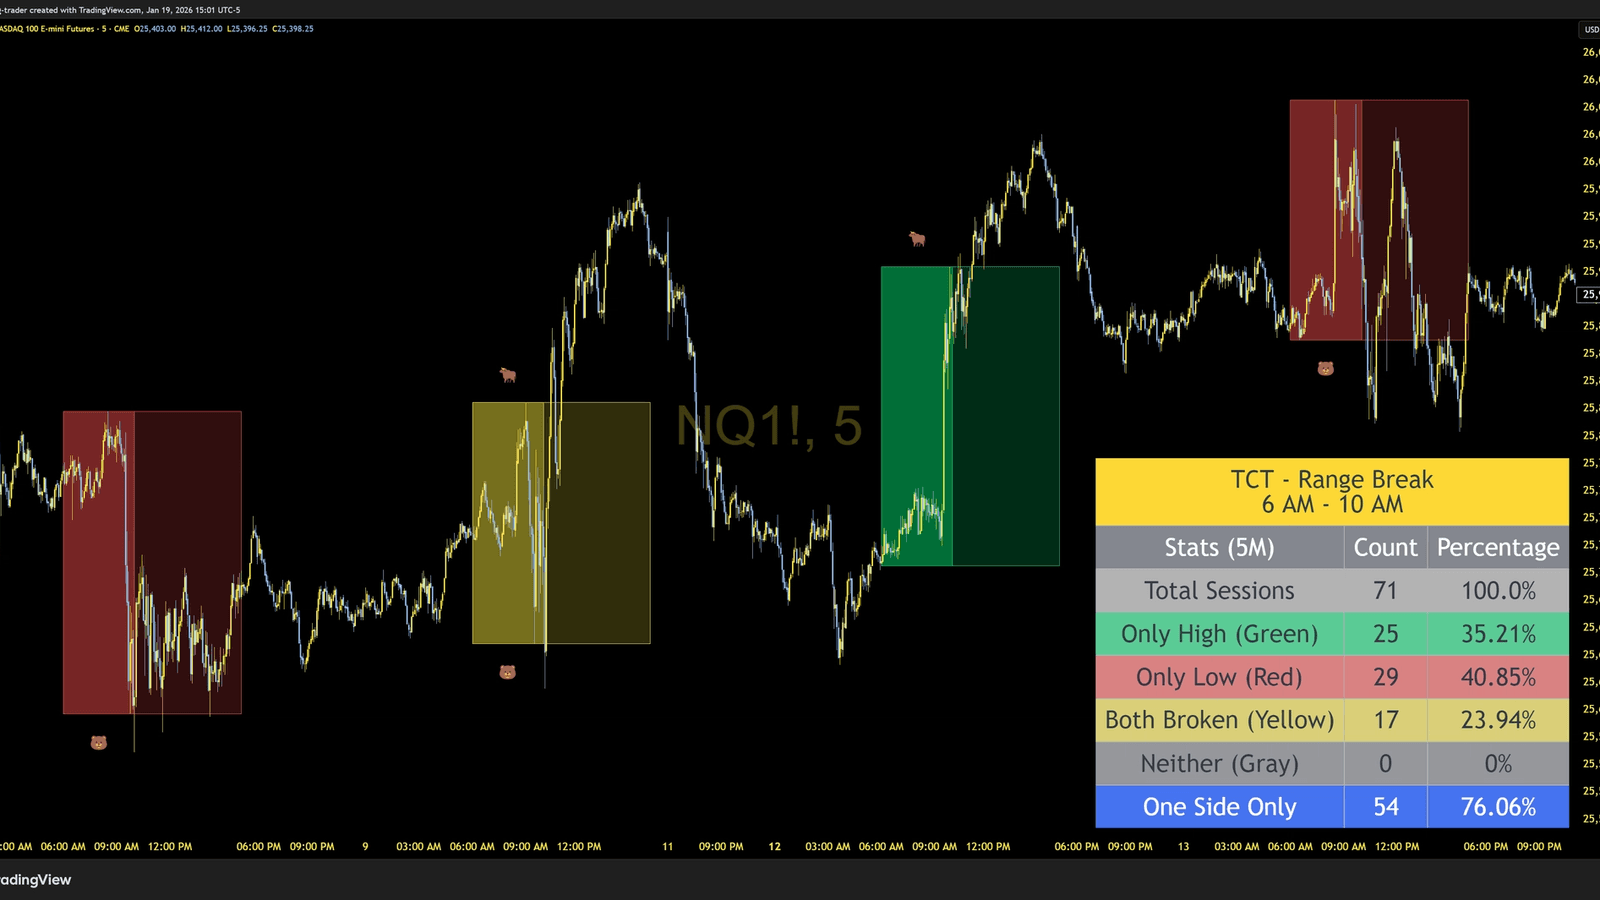
Built-in Statistics Dashboard
Validate your edge with hard data. The on-chart dashboard tracks historical breakout patterns so you know what to expect.
Breakout Distribution
See the historical percentage of bullish, bearish, both-broken, and range-bound sessions. Know at a glance whether your instrument tends to trend or chop.
Day of Week Analysis
See which days have the best clean breakout rates. View the best day at a glance or expand to a full Monday through Friday breakdown with session counts and percentages.
4 Table Themes
Actual colors from the indicator
Features
- ✓Automated Range DetectionAutomatically captures the high and low of any user-defined time window. Default configuration tracks the 6:00 AM - 10:00 AM Eastern Time session, ideal for US equity futures.
- ✓Color-Coded Breakout SignalsVisual boxes that change color based on breakout status: Green for bullish, Red for bearish, Yellow for indecisive (both broken), and Gray for neutral (no breakout).
- ✓Built-in Statistics DashboardReal-time statistics table showing historical breakout patterns. Tracks total sessions, breakout counts, and percentage distribution to help validate your trading edge.
- ✓Instant Breakout RecognitionEmoji labels appear at the exact moment of breakout for immediate visual recognition of bullish or bearish breaks.
- ✓Built-in AlertsPre-configured alert conditions for bullish and bearish breakouts. Get notified via push, email, or webhook the moment price breaks the range.
- ✓Fully Customizable Time WindowsAdjust Range Start, Range End, and Box End times to match any trading strategy or market session worldwide.
- ✓Extensive Visual CustomizationCustomize colors for all breakout states, adjustable transparency levels, border styles (Solid, Dashed, Dotted), and emoji size options.
- ✓Multi-Market CompatibleWorks with US Index Futures, Forex (London/NY sessions), Stocks & ETFs, and Crypto markets. Adjust times based on your preferred trading windows.
See It In Action
Settings & Configuration


Ready to Get Started?
Get Range Break with your TCT Premium subscription. Includes setup guides, video walkthroughs, and downloads in your member dashboard.